Fundamental traders will argue their way is best and similarly technical traders will insist their way is best. In truth, understanding both is extremely helpful in trading. It is fundamentals that dictate trend and price; however, technical analysis is useful to assist with timing entries and exits and identify where to place a stop loss.
Technical analysis is very visual and allows us to analyse historical data with the belief that history will repeat itself. Part of why it works is the herd effect. If enough traders believe a level is worth buying or selling at it creates resistance and it becomes more difficult to break, however, that does not mean the level will not be broken, especially if fundamentals change!
There are many different chart types and indicators and as such it is important to create a technical setup that works for you and the contract you will trade. Here I would suggest you explore different asset classes and products to find the one that you feel most connected to. Then experiment with different charts and indicators to find the best combination of chart, timeframe, and indicators. As with trading, keep it as simple as possible, maybe one or two chart types and a maximum of three indicators, as less is more!
Timeframes are important as it will depend on how long you intend to keep a trade open for as to the timeframe(s) you use to analyse, and you will find traders use shorter ones than investors.
If you are trading more than one contract, especially asset classes you may discover you need different setups for each!
Although there are many to choose from the most popular chart is the candlestick chart, this does not mean you have to use it though! Try all of them to find which one you prefer, plus there are over three hundred indicators (remember, maximum 3) and it is important to ensure your setup of chart(s) and indicators compliment and not conflict.
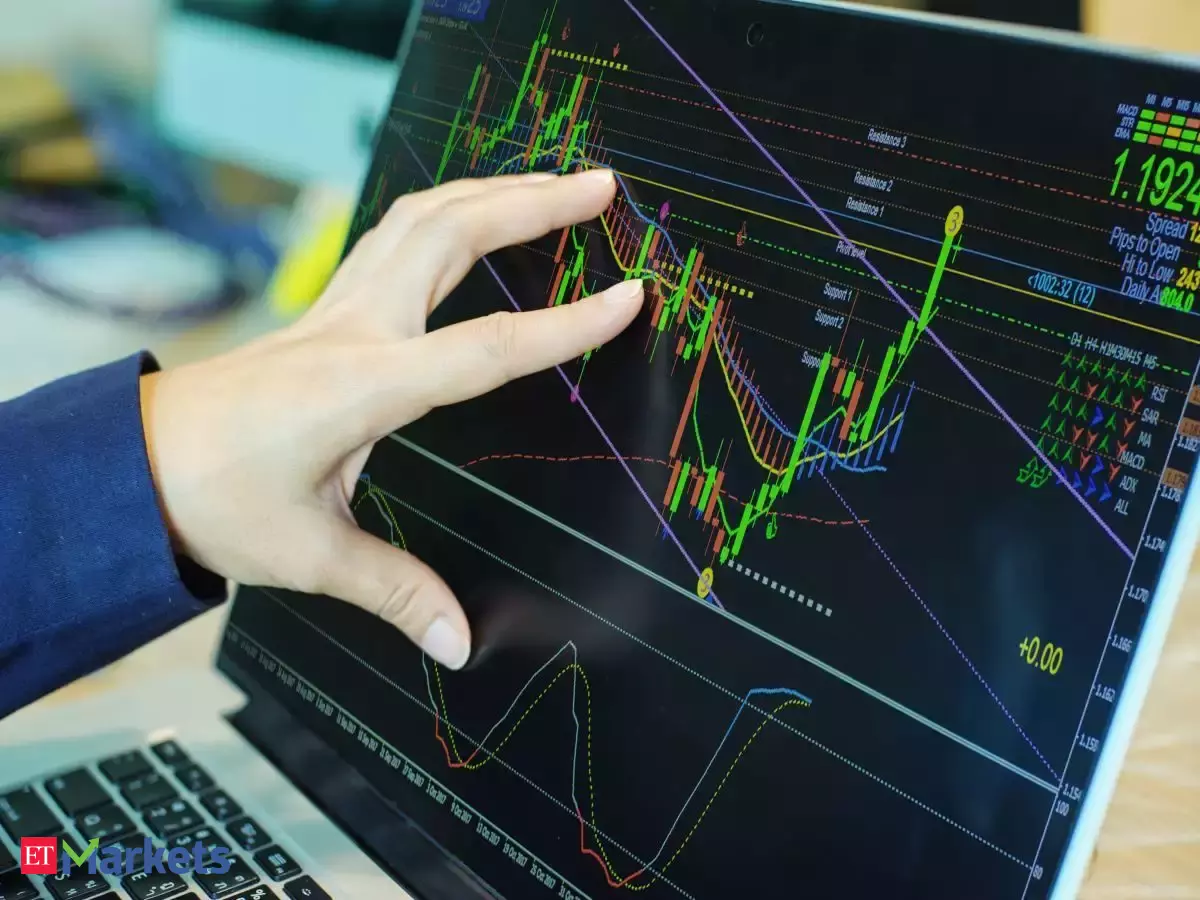
When we analyse charts, we look for support and resistance, trend lines, double or triple tops or bottoms, and perhaps Bollinger Bands or Fibonacci, RSI or MACD. Basically, anything that will help identify levels that will increase our chances of success and provide those high-probability entries.
Levels also assist in identifying where to place our stop loss in case the line is broken.
It is useful to remember that sometimes a line is only briefly broken (called a false breakout) and then it reverses leaving the line intact on the subsequent candles or bars etc. If the level remains broken it then reverses its role, a support line. becomes resistance and a resistance line would become support.
I hope this helps you understand a little regarding technical analysis. Yes, it works, however, is it right for you will only be known by extensively practicing using it. I would suggest you take the time to research the fundamentals that impact your product too, along with any correlated contracts that could also help in your decision making. Once you have practiced for a while, try NOT using charts in a practice session and see how you get on!
If it does work for you then it will become an invaluable part of your trading plan.
Symax Fintech Academy offers a one-day workshop on technical analysis to help you learn various chart types and how to use them, along a select few indicators used by pro traders.